

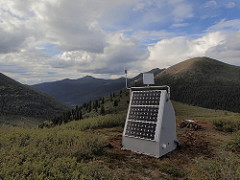
J04D
Umpqua National Forest, Toketee, OR, USA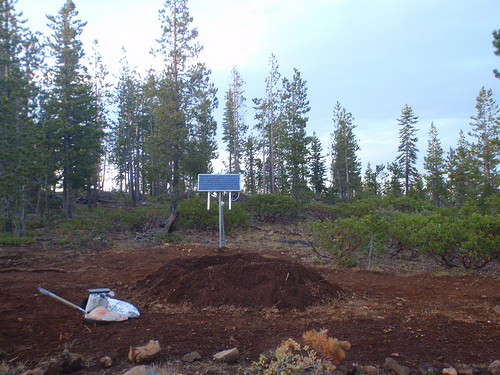
The USArray component of the NSF-funded EarthScope project ended its observational period in September 2021 and all remaining close-out tasks concluded in March 2022. Hundreds of seismic stations were transferred to other operators and continue to collect scientific observations. This USArray.org website is now in an archival state and will no longer be updated. To learn more about this project and the science it continues to enable, please view publications here: http://usarray.org/researchers/pubs and citations of the Transportable Array network DOI 10.7914/SN/TA.
To further advance geophysics support for the geophysics community, UNAVCO and IRIS are merging. The merged organization will be called EarthScope Consortium. As our science becomes more convergent, there is benefit to examining how we can support research and education as a single organization to conduct and advance cutting-edge geophysics. See our Joining Forces website for more information. The site earthscope.org will soon host the new EarthScope Consortium website.

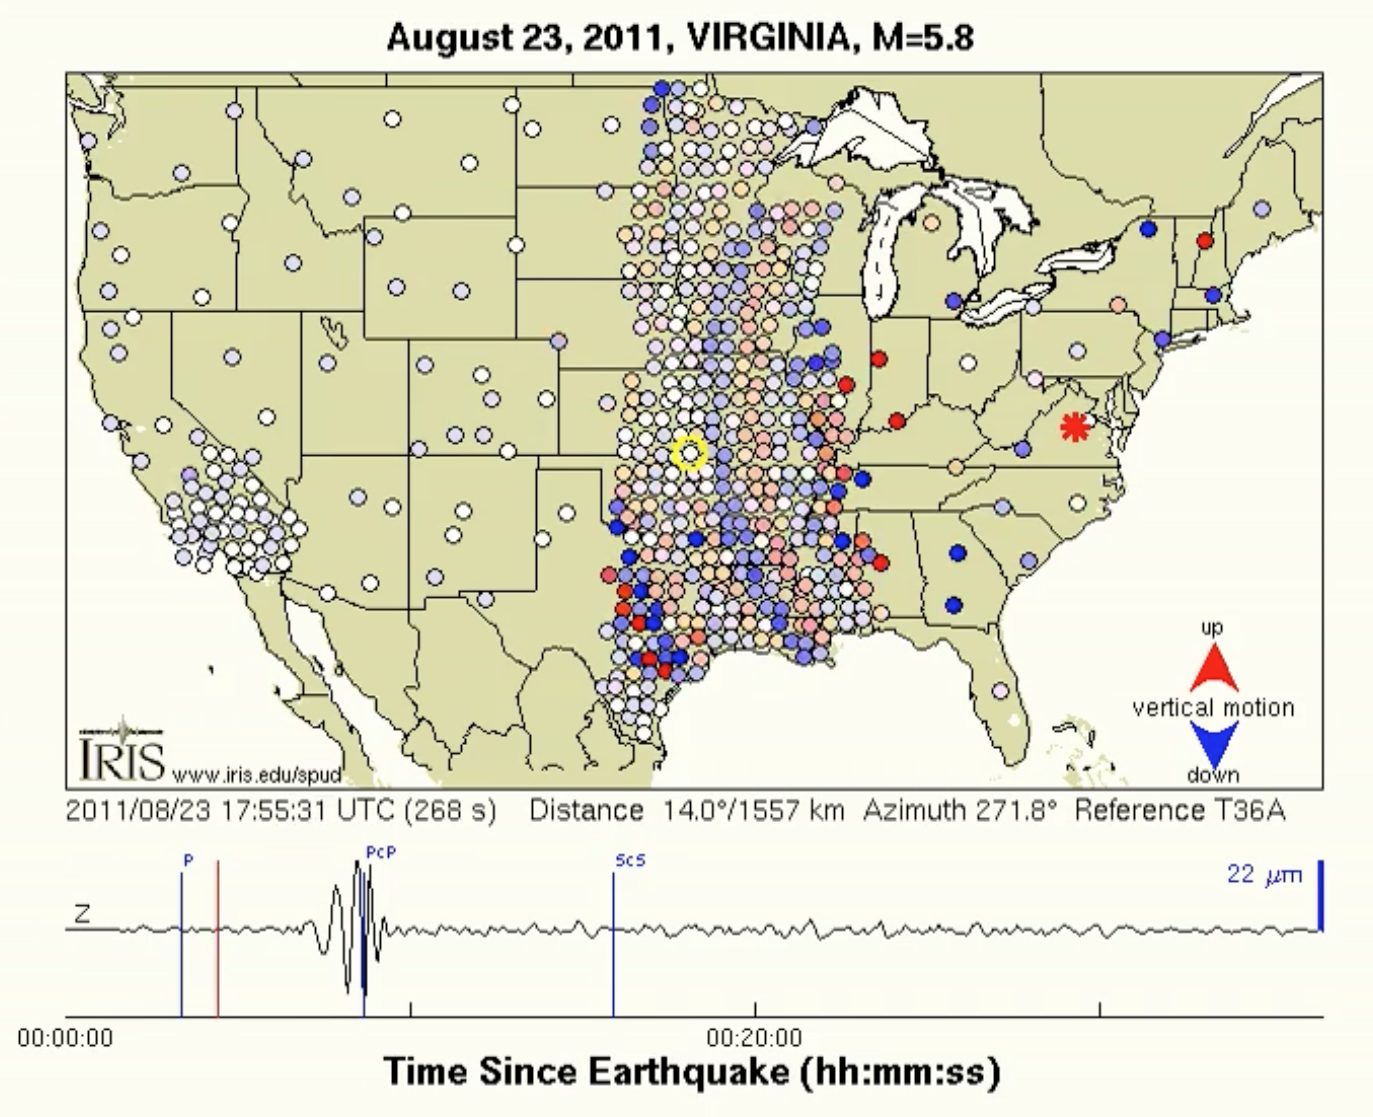 As earthquake waves travel along the surface of the Earth, they cause the ground to move. The ground motions can be captured and displayed as a movie, providing a visual demonstration of these often indiscernible movements. Charles Ammon, a professor at Penn State University, has developed animations of earthquake waves using actual earthquake data. The visualizations show how the ground moves as seismic waves sweep across about 400 earthquake recording stations in EarthScope’s Transportable Array. These innovative visualizations have been created for selected large earthquakes that have taken place in the US and around the world.
The visualizations illustrate how seismic waves travel away from an earthquake. Because the array’s seismometers are closely spaced in a grid pattern with unprecedented density, the recorded wave amplitudes at each seismometer clearly show through time how wave after wave progresses along the great circle path from the earthquake’s epicenter.
The circles in the visualization represent earthquake recording stations and the color of each circle represents the amplitude, or height, of the earthquake wave detected by the station’s seismometer. The color of the circle changes as waves of differing amplitude travel past the seismometer. Blue represents downward ground motion, red represents upward ground motion, and darker colors indicate larger amplitudes.
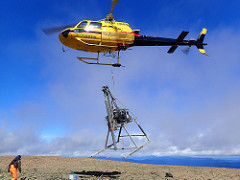
The hosts of Don't Panic Geocast spoke with IRIS Manager Bob Busby in early 2017 about what is involved in deploying a grid of seismic stations that will occupy nearly 2,000 locations in the conterminous US, Alaska, and parts of Canada. During this podcast, Bob discusses how technology advancements contributed to the success of the Transportable Array and the challenges of deploying stations in very remote environments. Click below to listen to the interview. Runtime approx. 70 minutes. Audio courtesy of Don't Panic Geocast.
 |
 |
 |
Bob Busby, USArray Transportable Array Manager, discusses EarthScope and the Transportable Array with Leonard Linklater, host of the radio show Midday Café which broadcasts to communities in the Yukon, along with Atlin in northern British Columbia. Click below to listen to the interview. Runtime approx. 11½ minutes. Audio courtesy of the Canadian Broadcast Corporation and Leonard Linklater.
 Bob Busby, Transportable Array Manager. |
 Leonard Linklater, host of Midday Café. |
IRIS has run a popular webinar series since 2011. A large number of webinars have focused on the results of research related to USArray. The majority of these webinars are recorded and available for subsequent viewing.
The IRIS Education and Outreach Program also has a wide variety of seismology related movies available on their website. These animations and videos explain introductory seismology concepts.
Numerous other videos are available through EarthScope's multimedia resources.
 IRIS Image Gallery
There are a wide variety of seismology images (including ones taken of USArray activities) available in the IRIS Image Gallery.
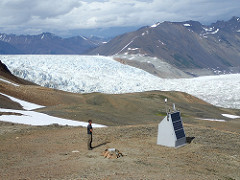
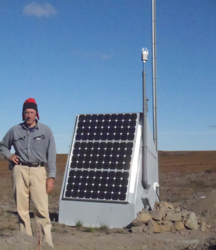
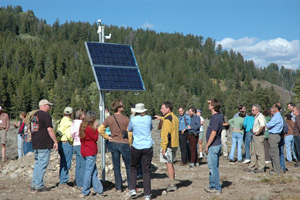
A slide show containing photos of the various USArray stations is available at: http://anf.ucsd.edu/stations/slideshow.php

