

BGNE
Belgrade, NE, USA
The USArray component of the NSF-funded EarthScope project ended its observational period in September 2021 and all remaining close-out tasks concluded in March 2022. Hundreds of seismic stations were transferred to other operators and continue to collect scientific observations. This USArray.org website is now in an archival state and will no longer be updated. To learn more about this project and the science it continues to enable, please view publications here: http://usarray.org/researchers/pubs and citations of the Transportable Array network DOI 10.7914/SN/TA.
To further advance geophysics support for the geophysics community, UNAVCO and IRIS are merging. The merged organization will be called EarthScope Consortium. As our science becomes more convergent, there is benefit to examining how we can support research and education as a single organization to conduct and advance cutting-edge geophysics. See our Joining Forces website for more information. The site earthscope.org will soon host the new EarthScope Consortium website.

The amount of significant, peer-reviewed science produced from the USArray facility has grown considerably over the past ten years. Below we highlight some scientific results in which USArray data were key to the analysis.
Numerous studies are exploiting all facets of the rapidly increasing USArray data set, which have resulted in more refined pictures of crustal and upper mantle structure beneath western North America. By combining thousands of seismic waveforms recorded by the Transportable Array with observations from seismic stations around the globe, high-resolution images of the structure under western North America have been produced. Additional tomography methodologies that combine data from the Transportable and Flexible Arrays, as well as data from existing regional networks, have also produced more high-resolution images of the earth’s interior.
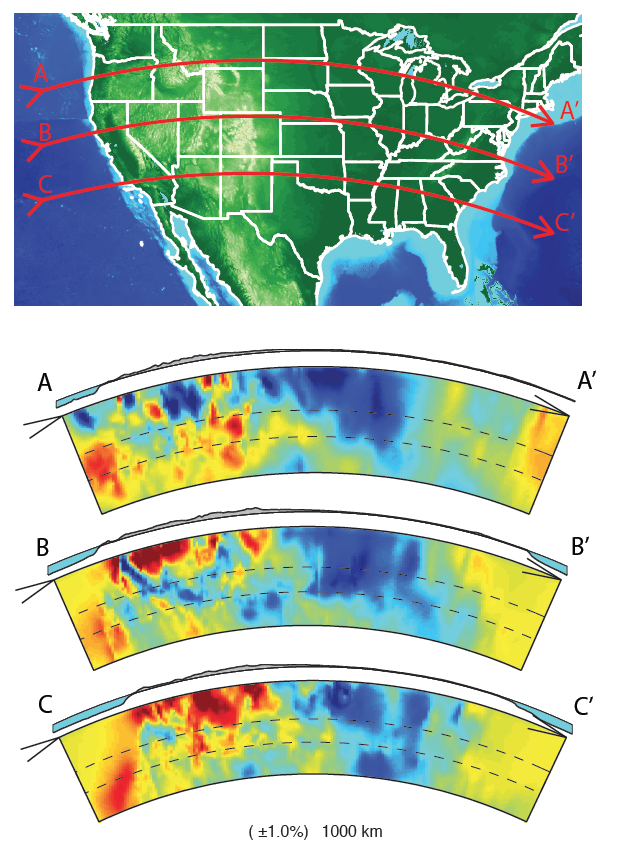
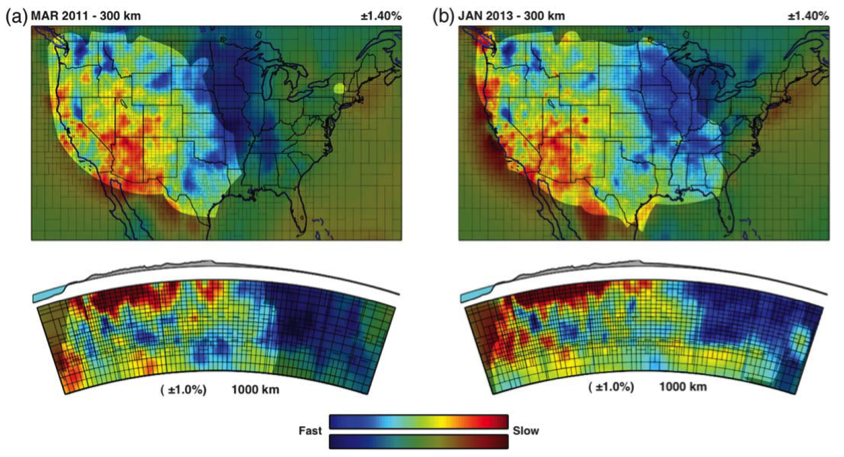
Using a method called travel time tomography, Burdick et al. [2008, 2010, 2012, 2014] create images that reveal heterogeneities in the geologic structure of the mantle beneath North America. Travel time tomography with global inversions of P-wave travel time residuals from regional and teleseismic earthquakes help to model Earth structure. In their latest update, Burdick et al. [2014] use more than 2.5 million TA travel-time residuals picked by the ANF to refine the mantle images even further. Over time, TA data will continue to help define Earth structure beneath the center of the continent. These data have already shown it to be more uniform than in the West.
 Burdick et al., 2012
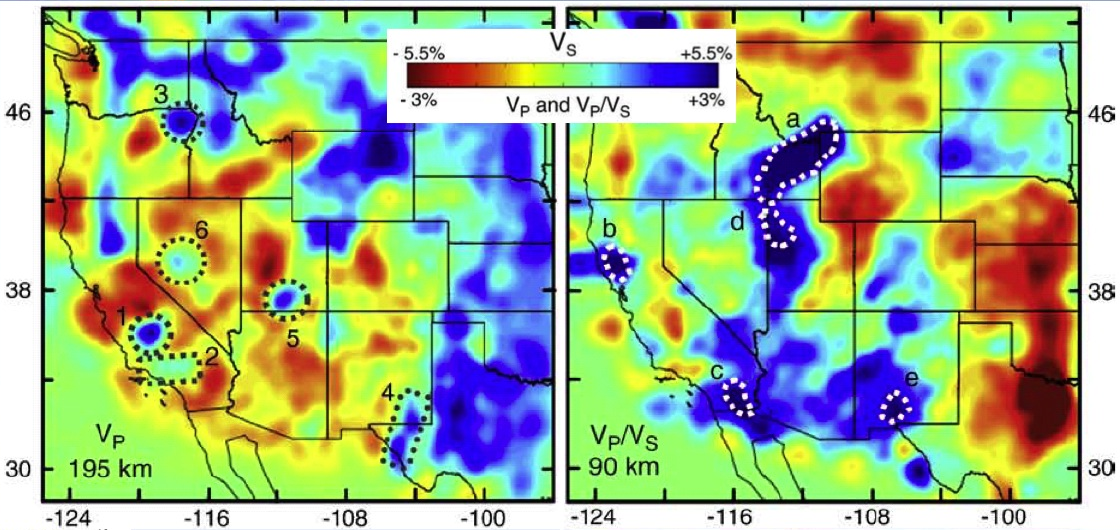 Schmandt and Humphreys, 2010
 Burdick et al., 2014
A recent innovation in seismic imaging reveals information about Earth structure without the occurrence of earthquakes. This technique, ambient noise tomography (ANT), is based on using long time series of noise that is present at all seismic stations. Application of ANT to data from ambitious new deployments of seismic arrays, such as USArray, has led to the development of large-scale seismic models of the earth’s crust and uppermost mantle at high resolution. In addition, new methods of data analysis and interpretation of ambient noise data that exploit the array nature of the Transportable Array are currently under development and have the potential to provide more reliable information about crustal and uppermost mantle anisotropy.
Using ambient noise recorded by TA stations in the western United States, Moschetti et al. [2010] developed tomographic images that (Figure 2) reveal strong deep (middle to lower) crustal radial anisotropy. This anisotropy is confined mainly to the geological provinces that have undergone significant extension during the Cenozoic Era (since ~65 Myr ago). These observations suggest that anisotropic crustal minerals were reoriented by the extensional deformation. These data also support the hypothesis that the deep crust within these regions has undergone widespread and relatively uniform strain in response to crustal thinning and extension.
 Yang et al., 2008
 Moschetti et al., 2010
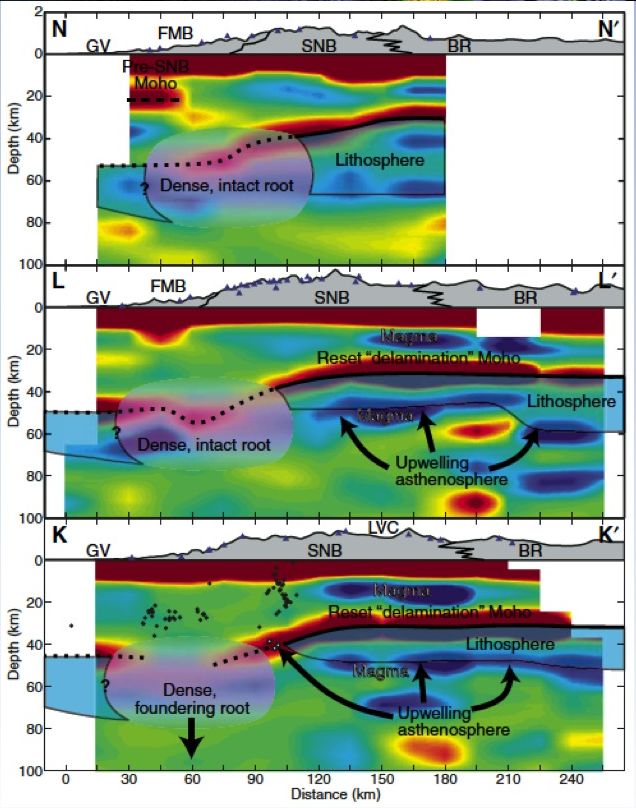
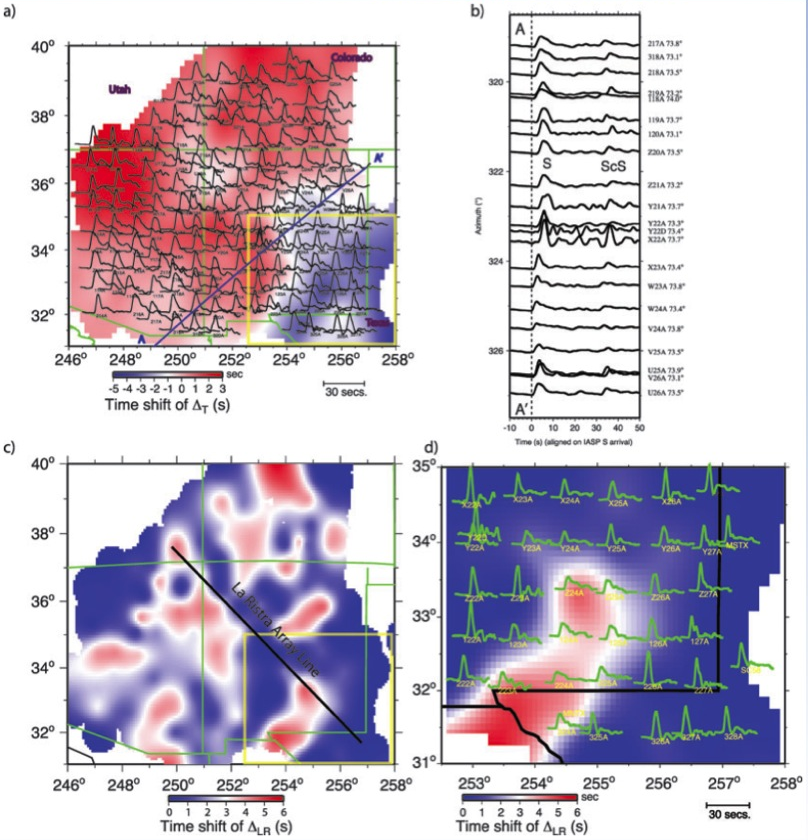
Regional mantle downwellings, referred to as lithospheric drips, are widely inferred to exist, based on surface expressions. However, direct observations of such downwellings have proved elusive, due to their small size and transient nature. Analyses of new seismic data recorded by the USArray Transportable Array and other regional broadband seismic stations combined with other non-seismic data provide clear evidence for a large lithospheric drip beneath the Great Basin in the western United States. Such analyses are revealing the importance of lithospheric drips in the framework of global tectonics.
 West, 2009
 Levander, 2011
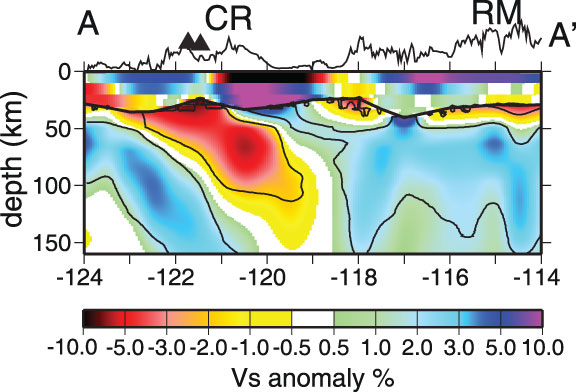
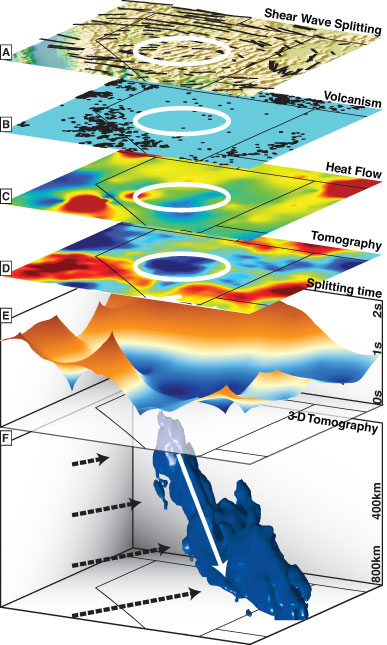
Significant earthquake hazard results from fault slip associated with the subduction of an oceanic plate beneath the region straddling the US-Canadian border. This plate collision is accompanied by intervals of surprisingly regular seismic tremor and slow fault slip that are not generally felt by the local population. Existence of this phenomenon was discovered prior to deployment of EarthScope instruments. However, the combined information from USArray and Plate Boundary Observatory data sets have provided critical new constraints that have greatly improved our understanding of this complex phenomenon. The new picture of the fault zone provided by data analyses suggests that the probable region of strong ground motion during future earthquakes extends significantly further inland than had been thought, closer to the large population centers of Cascadia.
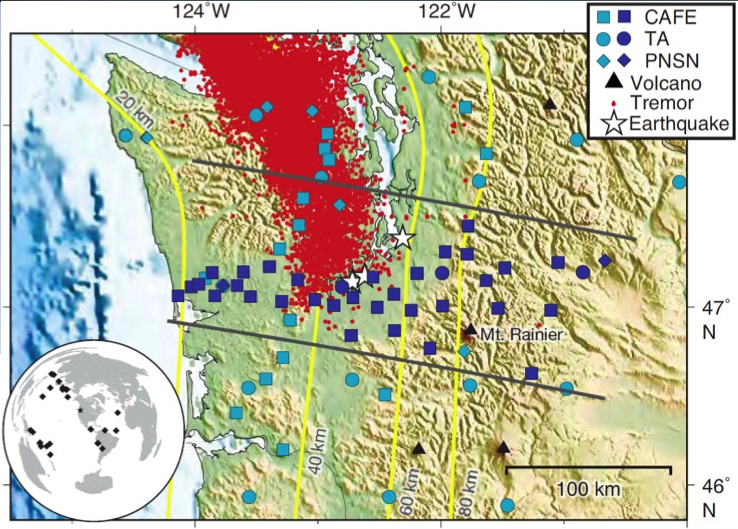 Abers, 2009
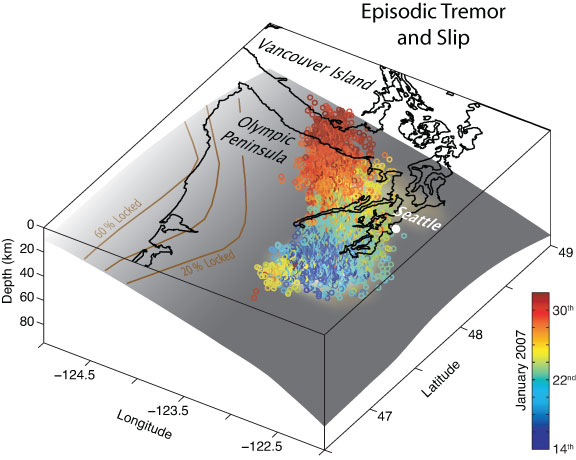 K. Creager. 2008
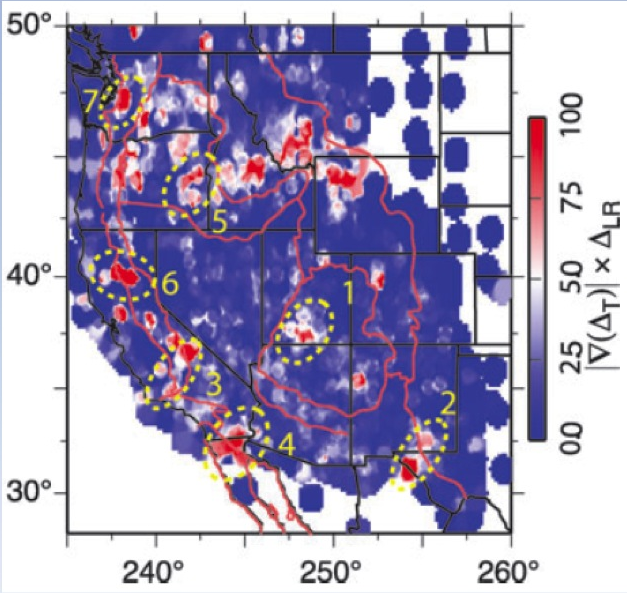
Transportable Array data provide a means for probing boundaries within the earth beneath USArray seismic stations. Key boundaries include the Mohorovicic discontinuity, which marks the transition between the crust and mantle, and the lithosphere-asthenosphere boundary, which marks the depth extent of continental structures. The resultant seismically determined boundary-depth maps can be combined with results from mineral physics and geochemistry to better understand the tectonic development and evolution of North America.
 Liu et al., 2012
 Frassetto et al., 2011, Geosphere
 Sun, 2011
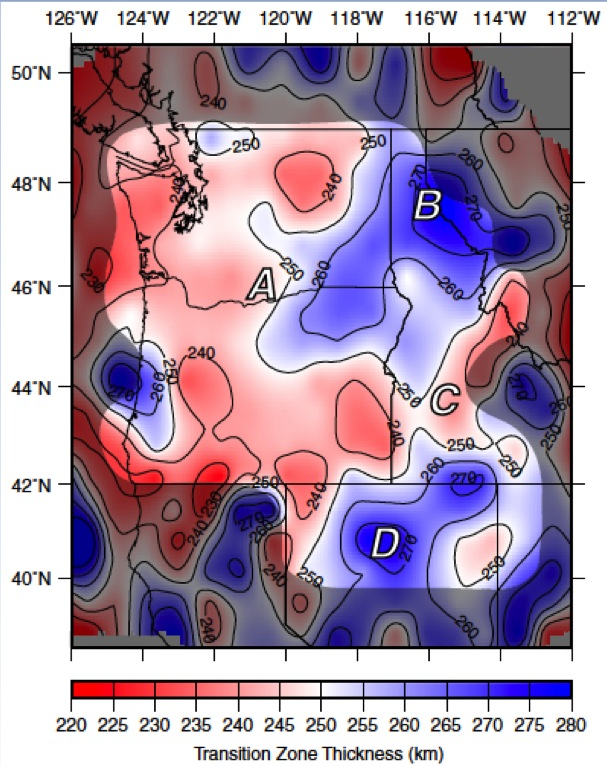 Eagar, 2010
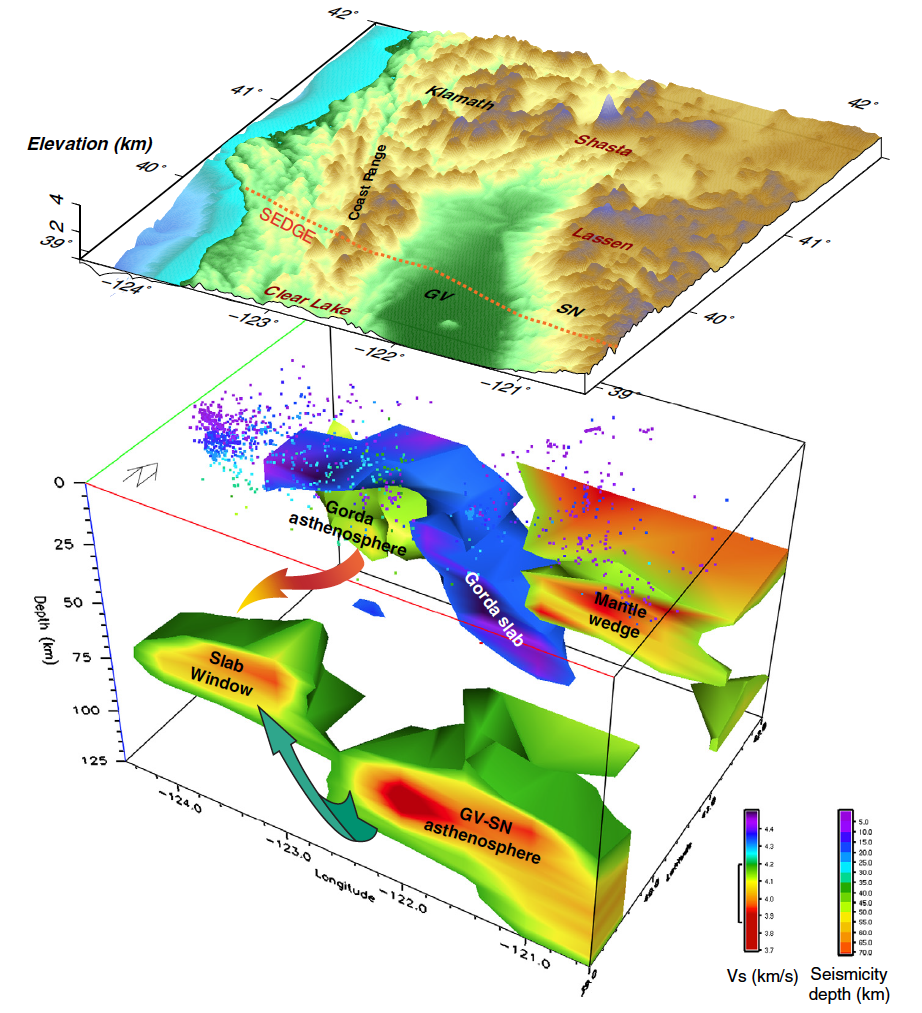
 A. Levander, Rice University; Meghan Miller, University of Southern California; and F. Niu, Rice University.
Mantle conductivity models generated from magnetotelluric data complement the seismic tomography images of the structure beneath North America. In some cases, conductivity observations provide constraints that are difficult to obtain from seismic data. For example, conductivity is particularly sensitive to the water content of the mantle. Joint interpretation of conductivity, velocity, and attenuation is beginning to provide better constraints on composition and physiochemical state than analysis of any one property alone. There is significant anticipation of further development of joint electrical and seismic interpretation of mantle observations.
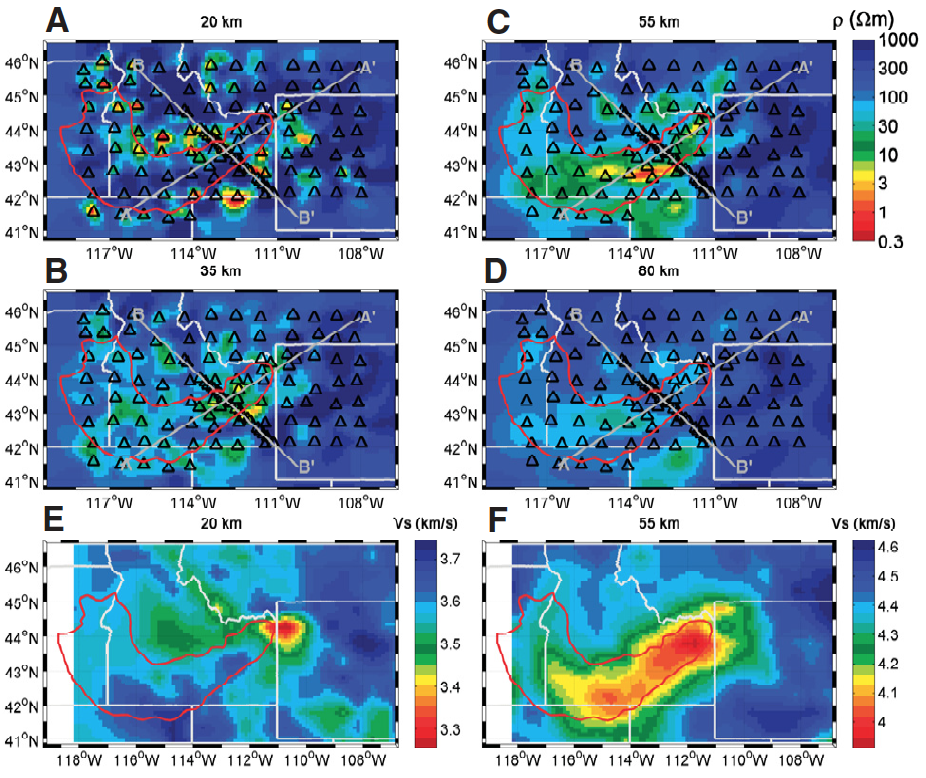
Kelbert et al. [2013] develop a regional three-dimensional electrical resistivity model for the Snake River Plain and Yellowstone areas (Idaho and Wyoming) by combining long-period magnetotelluric (MT) data from 91 USArray MT sites and previously collected MT profiles along and across the eastern Snake River Plain. This model provides new constraints on the large-scale distribution of melt and fluids beneath the Yellowstone hotspot track. The electromagnetic data, which are highly sensitive to the presence of melt and volatiles, suggest that there is little or no melt in the lower crust and upper mantle directly beneath Yellowstone caldera. Instead, low mantle resistivities (10 Ωm and below) are found 40–80 km beneath the eastern Snake River Plain, extending at least 200 km southwest of the caldera, beneath the area of modern basaltic magmatism. The reduced resistivities extend upward into the mid-crust primarily around the edges of the Snake River Plain, suggesting upward migration of melt and/or fluid is concentrated in these areas. The anomaly also shallows toward Yellowstone, where higher temperatures enhance permeability and allow melts to ascend into the crust. The top of the conductive layer is at its shallowest in the upper crust, directly beneath the modern Yellowstone supervolcano.
 Kelbert et al., 2012
 Patro and Egbert, 2008
 Zhdanov, 2011
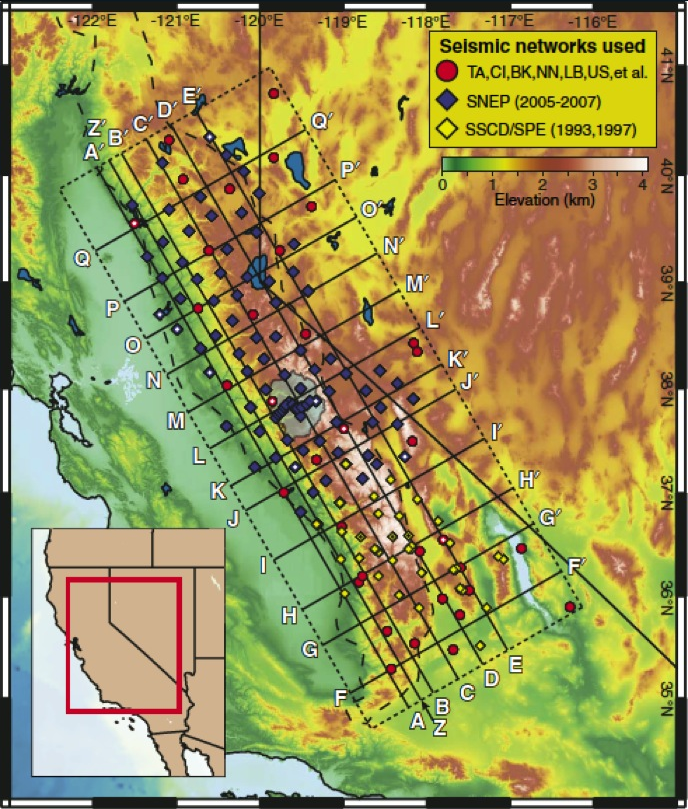
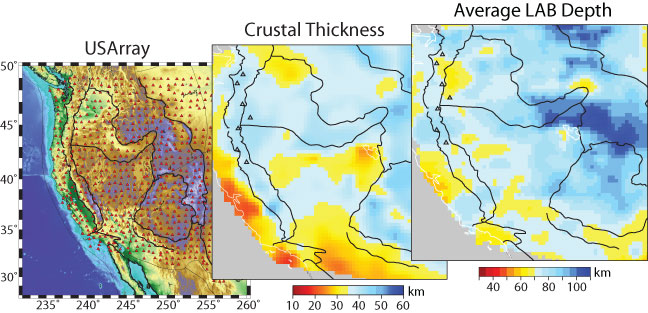
Earthscope seismic receiver functions, along with gravity and surface heatflow measurements, are used to estimate the thickness and Vp/Vs (Poisson's ratio) of the crust in the western United States. This data is used to relate composition and strength of the crust and explain deformation potential of the Western Cordillera.
Image courtesy of Anthony Lowry, Utah State University, and Marta Pérez-Gussinyé, Royal Holloway, University of London, Egham, Surrey

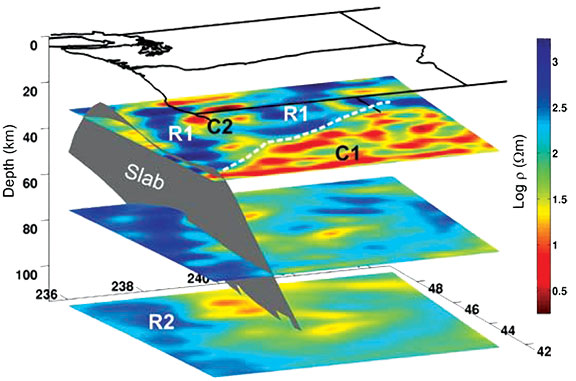
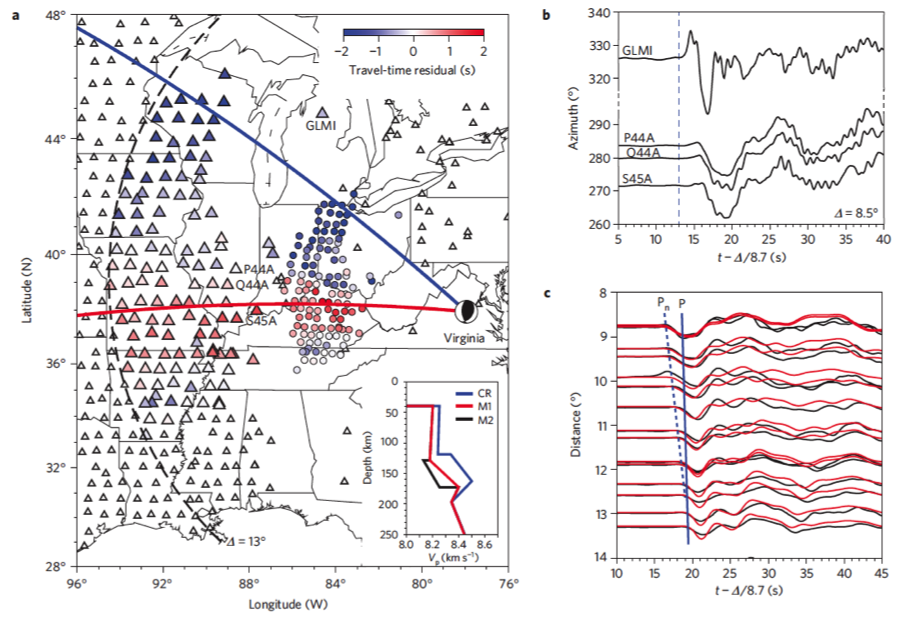
Hotspot tracks are thought to be the surface expressions of tectonic plates moving over upwelling mantle plumes, and are characterized by volcanic activity that is age progressive. At present, most hotspot tracks are observed on oceanic or thin continental lithosphere. For old, thick continental lithosphere, such as the eastern United States, hotspot tracks are mainly inferred from sporadic diamondiferous kimberlites putatively sourced from the deep mantle. Chu et al. [2013] use seismic waveforms initiated by the 2011 Mw 5.8 Virginia earthquake, recorded by USArray TA, to analyze the structure of the continental lithosphere in the eastern United States. They identify an unexpected linear seismic anomaly in the lower lithosphere that has both a reduced P-wave velocity and high attenuation, and which they interpret as a hotspot track. The anomaly extends eastward, from Missouri to Virginia, cross-cutting the New Madrid rift system, and then bends northwards. It has no clear relationship with the surface geology, but crosses a 75-million-year-old kimberlite in Kentucky. They suggest that the hotspot track could be responsible for late Mesozoic reactivation of the New Madrid rift system and seismicity of the eastern United States.
 Chu et al., 2013
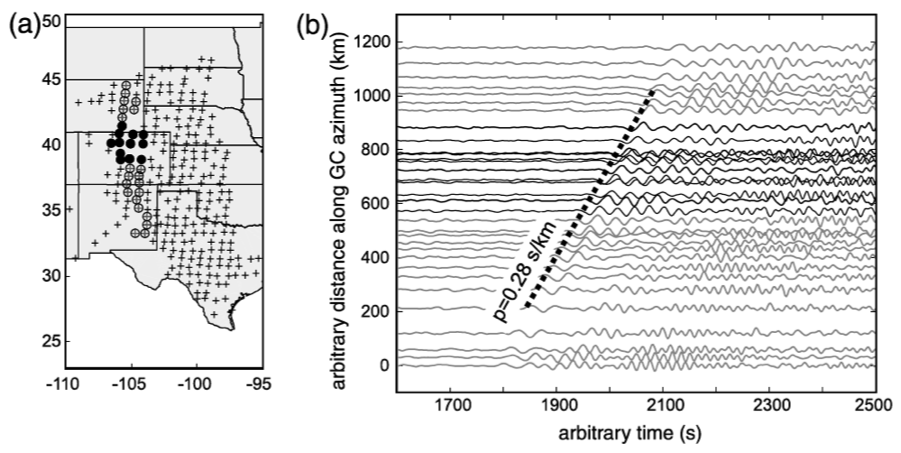
Poppeliers [2011] uses a new technique called the multiwavelet transform to derive uncertainty estimates for wave parameters obtained by seismic wave gradiometry. Wave gradiometry uses spatial gradients as measured by a small-scale seismic array to estimate wave parameters, including propagation azimuth, slowness, geometrical spreading, and radiation pattern. The advantage of wave gradiometry is that the wave parameters are estimated on a point-by-point basis for the entire seismogram. Poppeliers [2011] uses the multiwavelet transform to decompose the wave field into a series of mutually orthogonal wavelet coefficients, which can then be analyzed by wave gradiometry. They used TA data to demonstrate that the method accurately and robustly determines the wave parameters of large teleseismic earthquakes.
 Poppeliers, 2011
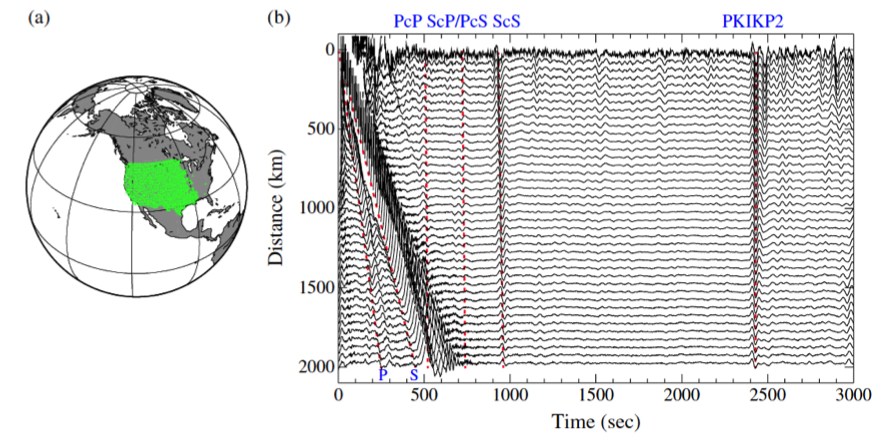
Seismic body waves that travel through Earth’s core are indispensable for studying remote inner regions of our planet. Traditional core phase studies rely on well-defined earthquake signals, which are spatially and temporally limited. Lin et al. [2013], using data from pairs of TA stations, show that by stacking the more common, but lower amplitude ambient noise signals (a technique called interferometry), body wave phases reflected off the outer core (ScS) and twice refracted through the inner core (PKIKP2) can be clearly extracted. Temporal correlation between the amplitude of these core phases and global seismicity suggests that the signals originate from distant earthquakes. Similar results from a seismic array in New Zealand demonstrate that the approach is applicable in other regions and with fewer station pairs. Extraction of core phases by interferometry can significantly improve the spatial sampling of the deep Earth because the technique can be applied anywhere broadband seismic arrays exist.
 Lin et al., 2013
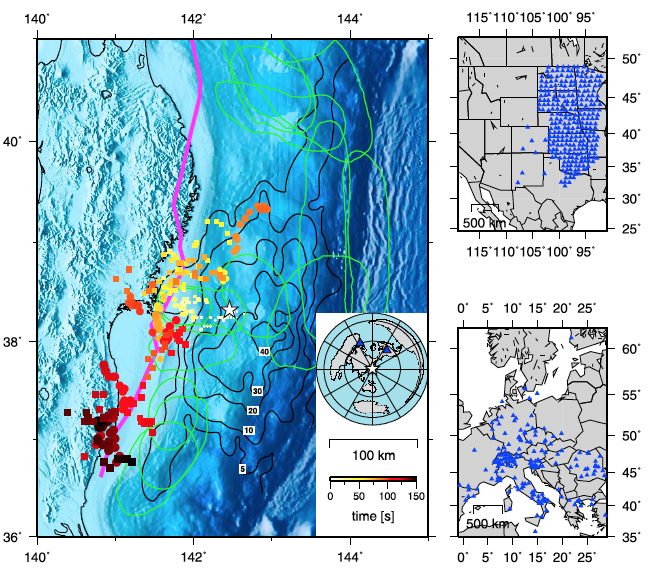
Data sets from the USArray of major earthquakes have enabled very precise back-projections which have revealed details of the source dynamics. Meng et al. [2011] examine the 2011 Mw9 Tohoku-Oki earthquake, which was recorded by over 1000 near-field stations and multiple large-aperture arrays such as USArray. These arrays reveal rupture complexity with unprecedented resolution. They show that the earthquake ruptured in phases at diverse speeds, including intermittent high-frequency bursts within slow speed phases, suggesting spatially heterogeneous material properties.
 Meng et al., 2011
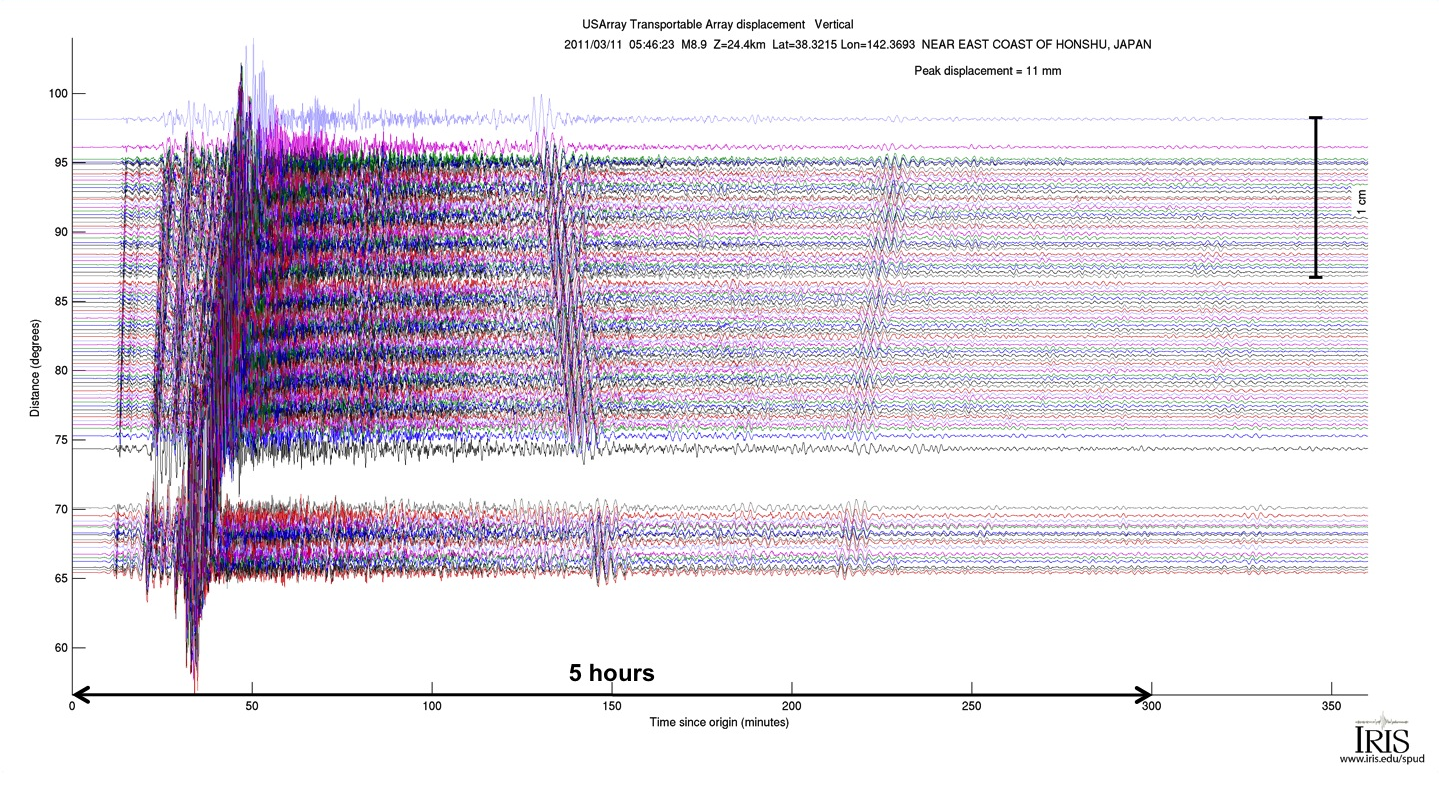 Record sections show M9.0 earthquake from Japan as seen by the Transportable Array.
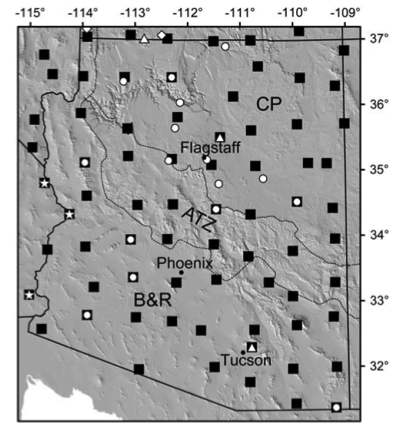
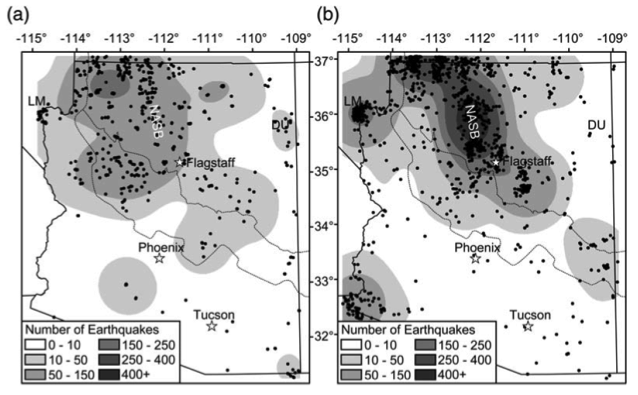
A detailed record of earthquake frequency and distribution is essential to understanding regional tectonic strain and seismic hazard, particularly in regions of low, but significant, seismicity levels. Comprehensive analyses of seismicity within Arizona have not been previously possible due to a lack of seismic stations in many regions, contributing to the perception that earthquakes within Arizona are rare and generally limited to the north-central and northwestern portions of the state. The TA deployment within Arizona from April 2006 to March 2009 provided the opportunity to examine seismicity on a statewide scale. In this study, Lockridge et al. [2012] developed a streamlined workflow for producing a comprehensive earthquake catalog using TA data, and combined their catalog with historical earthquake catalogs to produce the first comprehensive earthquake catalog for the state of Arizona. The TA-derived catalog is complete to local magnitude ML 1.2, contains crustal events as small as ML 0.0, and includes events located within several previously unidentified areas of seismic activity in Arizona. Identified earthquake swarms and clusters, such as those documented in this study, may represent important regions of small-scale tectonic strain release within intraplate regions that otherwise have apparently low seismicity levels.
 Lockridge et al., 2012
The USArray Array Network Facility (ANF) recently published an overview of its network event bulletin (http://www.iris.edu/spud/eventbulletin), generated from USArray TA recordings between April 2004 and November 2013. During this period as the TA migrated eastward, 53% of the events listed in the ANF bulletin were unique (not listed in any other catalog). East of Washington, Oregon, and California between 60% and 80% of the ANF listings were unique, demonstrating the vastly improved detection threshold provided by the TA. The study also helps to discriminate anthropogenic seismic sources, such as daytime mine blasts. The ANF bulletins provide a much more comprehensive picture of seismic sources across the United States during TA deployment than previously available.
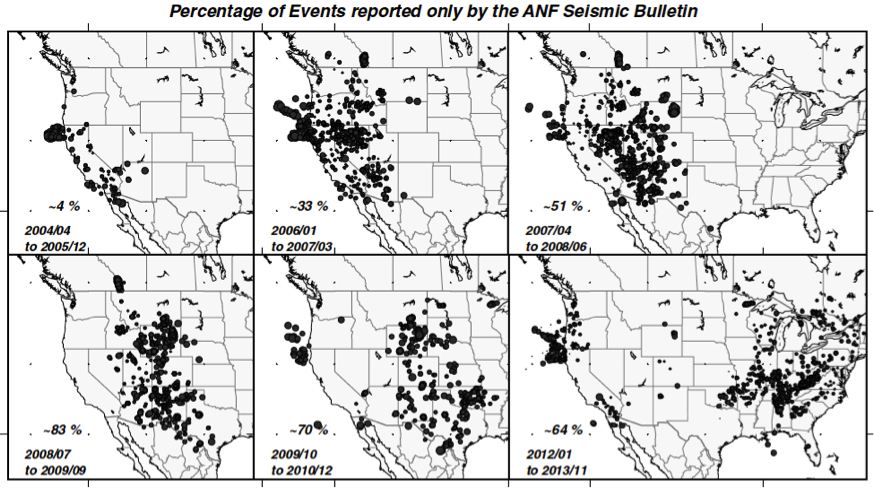 Astiz et al., 2014
In November 2011, a M5.0 earthquake occurred less than a day before a M5.7 earthquake near Prague, Oklahoma. Sumy et al. [2014] detect and locate earthquakes using data from an IRIS PASSCAL RAMP (Rapid Array Mobilization Program) experiment and the USArray TA to examine the role that coseismic Coulomb stress transfer plays in generating earthquakes that follow the M5.0 foreshock. They find that the foreshock promoted failure on the Wilzetta fault rupture plane, resulting in the M5.7 mainshock and thousands of aftershocks, including one of M5.0. They argue that fluid injection induced the M5.0 foreshock, and possibly triggered cascading failure along the complex Wilzetta fault system.
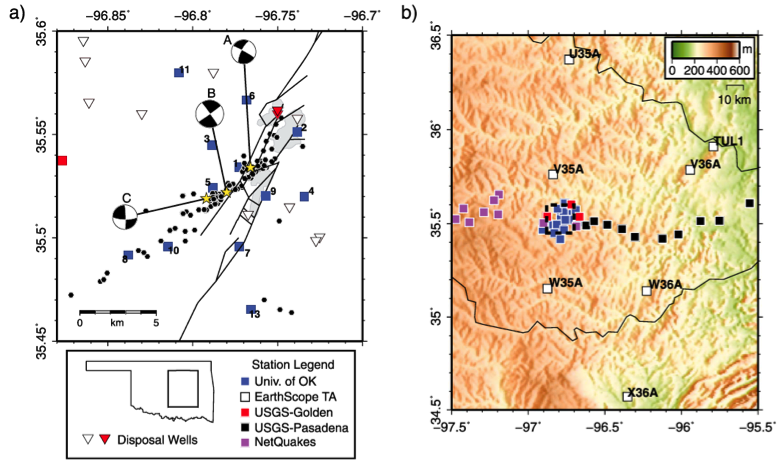
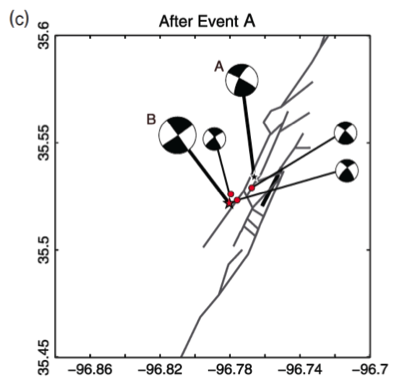
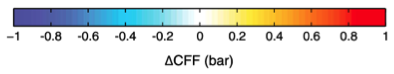 Sumy et al., 2014
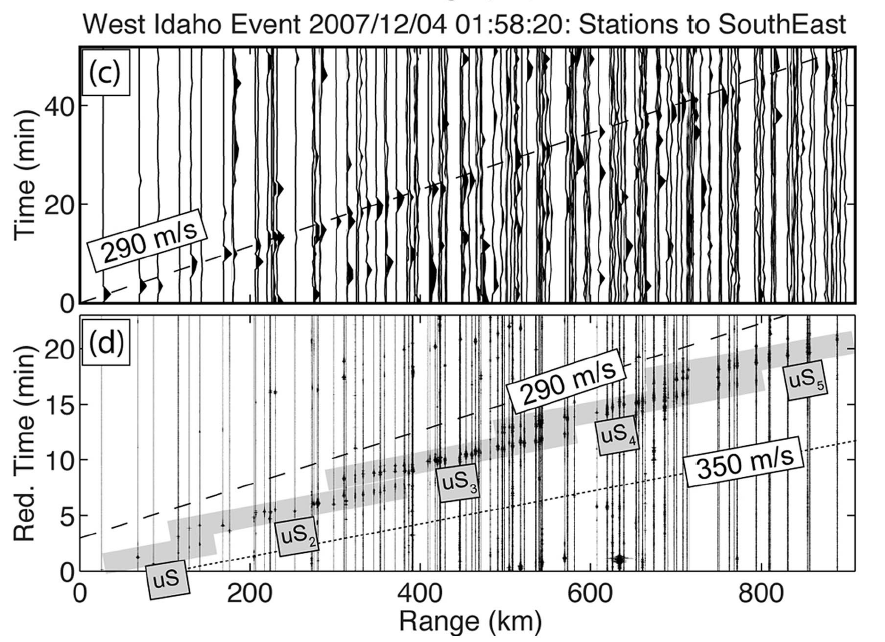
Many of the USArray Transportable Array stations have been equipped with infrasound microbarographs. This dense array of acoustic sensors has enabled large-scale infrasonic detection and source location studies. These studies use reverse time migration methods with acoustic-to-seismic coupled signals to locate sources.
Walker et al. [2011] use reverse time migration to detect and locate 901 sources of atmospheric infrasound recorded by TA from 2007–2008 and to define the Western United States Infrasonic Catalog (WUSIC). The event locations illuminate repeating sources of infrasound, or “infrasonic hot spots,” in Nevada, Utah, and Idaho that are spatially located within active military areas. The results of this study show that relatively dense seismic networks like USArray fill in the gaps between sparsely located infrasound arrays and provide valuable information for regional infrasonic source location and propagation studies. The WUSIC catalog can be used to statistically validate and improve propagation models, especially above the middle stratosphere where ground-based weather stations or meteorological satellites do not directly measure winds.
 Walker et al. 2011

