

I05D
Terrebonne, OR, USA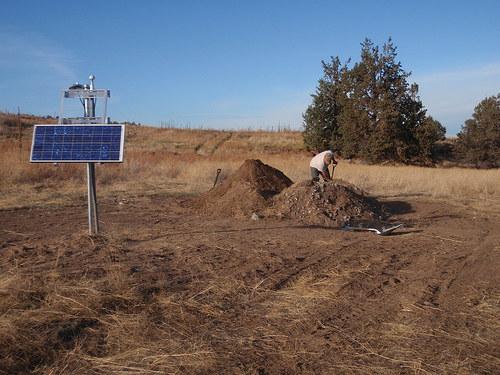
The USArray component of the NSF-funded EarthScope project ended its observational period in September 2021 and all remaining close-out tasks concluded in March 2022. Hundreds of seismic stations were transferred to other operators and continue to collect scientific observations. This USArray.org website is now in an archival state and will no longer be updated. To learn more about this project and the science it continues to enable, please view publications here: http://usarray.org/researchers/pubs and citations of the Transportable Array network DOI 10.7914/SN/TA.
To further advance geophysics support for the geophysics community, UNAVCO and IRIS are merging. The merged organization will be called EarthScope Consortium. As our science becomes more convergent, there is benefit to examining how we can support research and education as a single organization to conduct and advance cutting-edge geophysics. See our Joining Forces website for more information. The site earthscope.org will soon host the new EarthScope Consortium website.

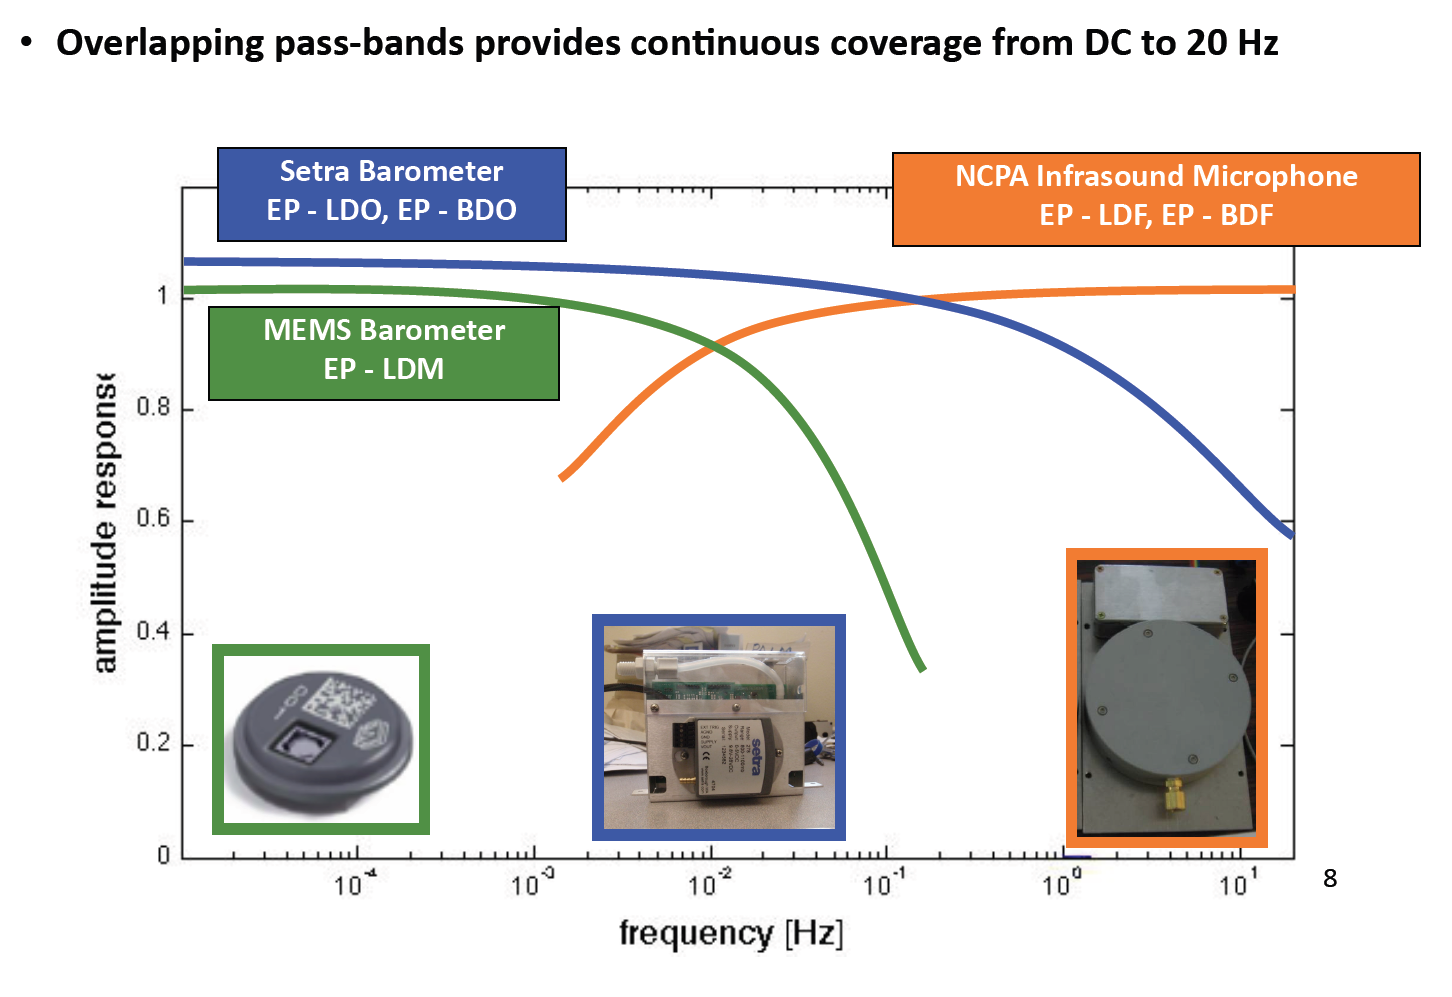
Enabled by an MRI-R2 grant from the National Science Foundation to the University of California-San Diego, advanced atmospheric sensors have been included with newly installed Transportable Array stations since mid-2010. In addition to the Micro-Electro-Mechanical (MEMS) state-of-health barometer included within the vault at all installations since 2004, each station also features an external high frequency infrasound microphone (NCPA model IFS-4532) and a low to intermediate frequency microbarometer (Setra 278). The compared responses of all three instruments demonstrate the wide spectrum of atmospheric signals now recorded.
IRIS DMC Infrasound Event Database
Special Presentation from UCSDTV. "Listening to Earth's Atmosphere: Tuning into the Sounds of Our Dynamic Planet"
The data from these stations are accessed through the IRIS Data Management Center (DMC). The DMC's web services are a quick way to view and obtain data and a brief tutorial can be found here.
A tutorial on data access within MATLAB can be found here.
An IRIS webinar on data access can be seen here.
The following figures were created using the web services timeseries URL builder, and show data from the MEMS barometer and thermometer at station U32A. This station was deployed as part of the TA in 2009 and adopted by the Oklahoma Geological Survey in 2012. These data span two days in April 2012 during a major tornado outbreak across the region. The gaps in the measurements are due to interference of the telemetry caused by the severe weather. The missing points will be restored when the archived data is obtained manually when the station is periodically serviced.
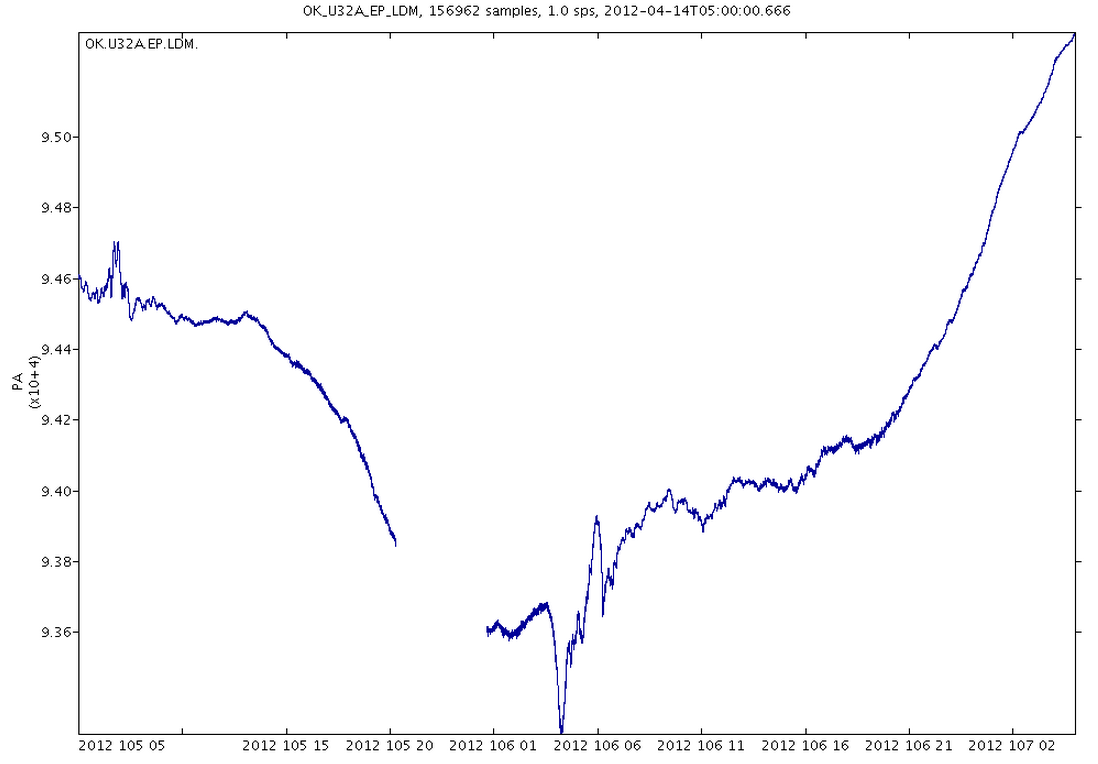
Pressure measurements spanning 48 hours from midnight CDT on 14 April 2012. A broad drop in pressure mirrors the passage of the severe weather front. The spike around midnight on April 15 coincides with a F3 tornado striking the town of Woodward, Oklahoma approximately 20 miles to the west. (Click on the plot to enlarge.)
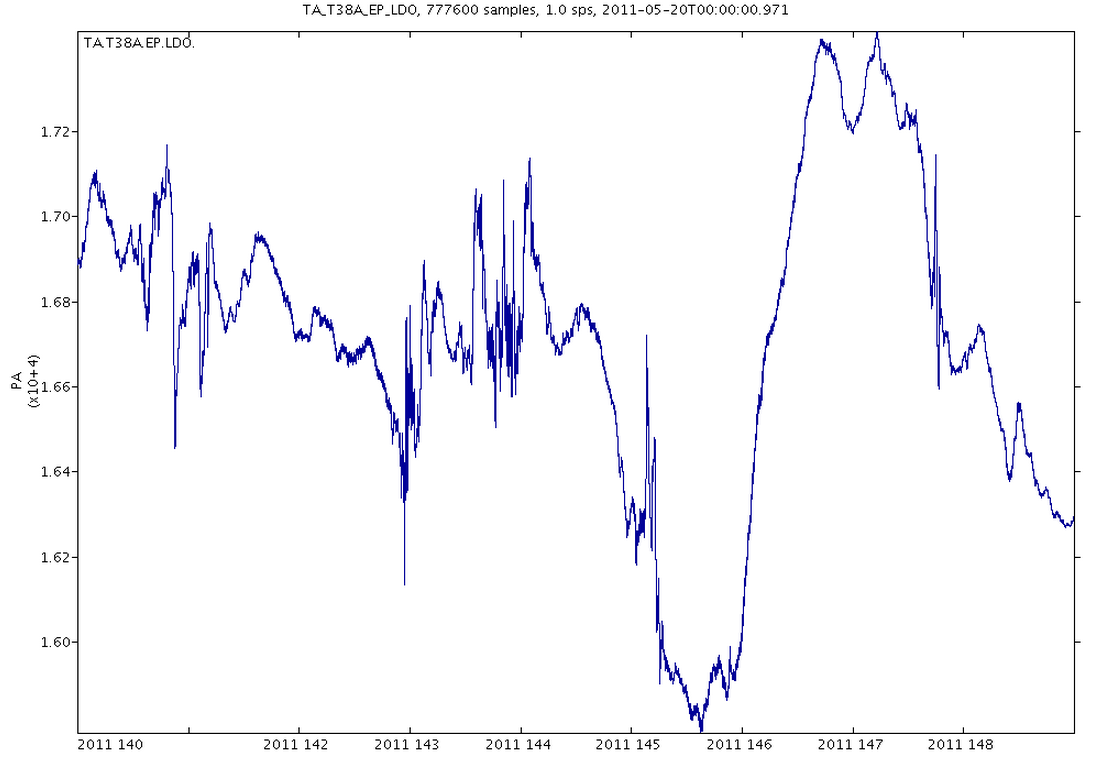
All Transportable Array stations are currently equipped with an automated weather station barometer, the Setra 278. The following chart shows pressure taken from a Setra barometer at station T38A over a 9 day period starting May 20, 2011. There were widespread reports of severe weather near this station during this time.
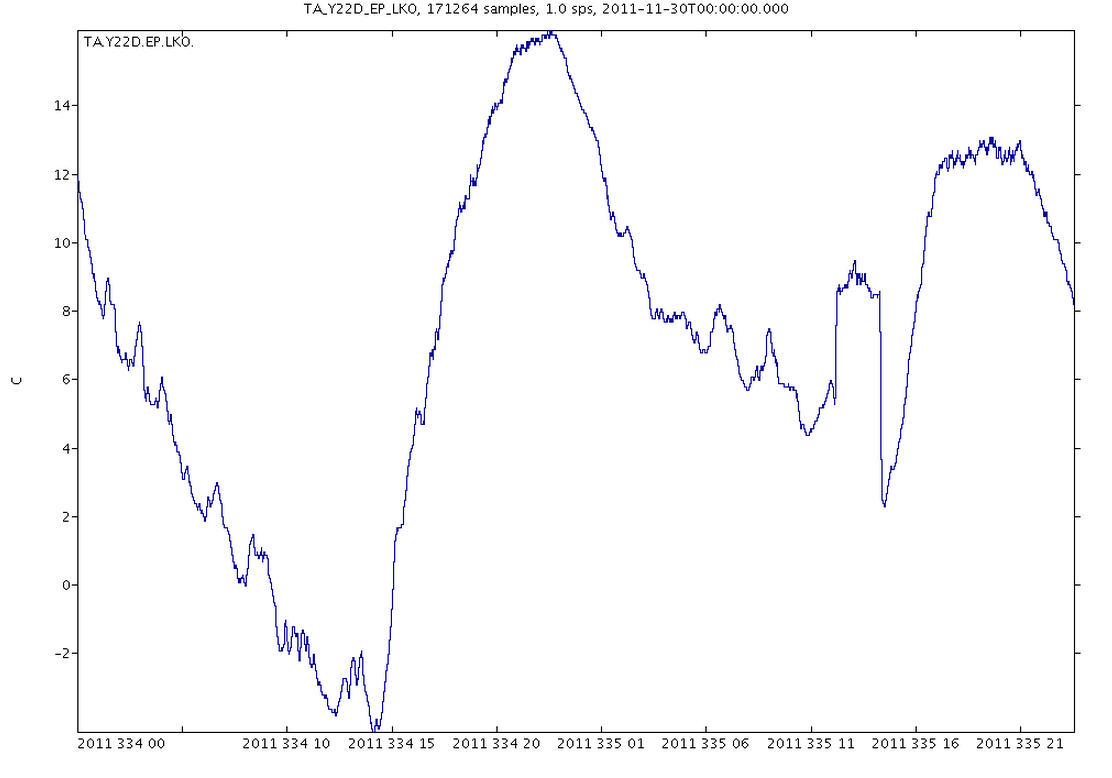
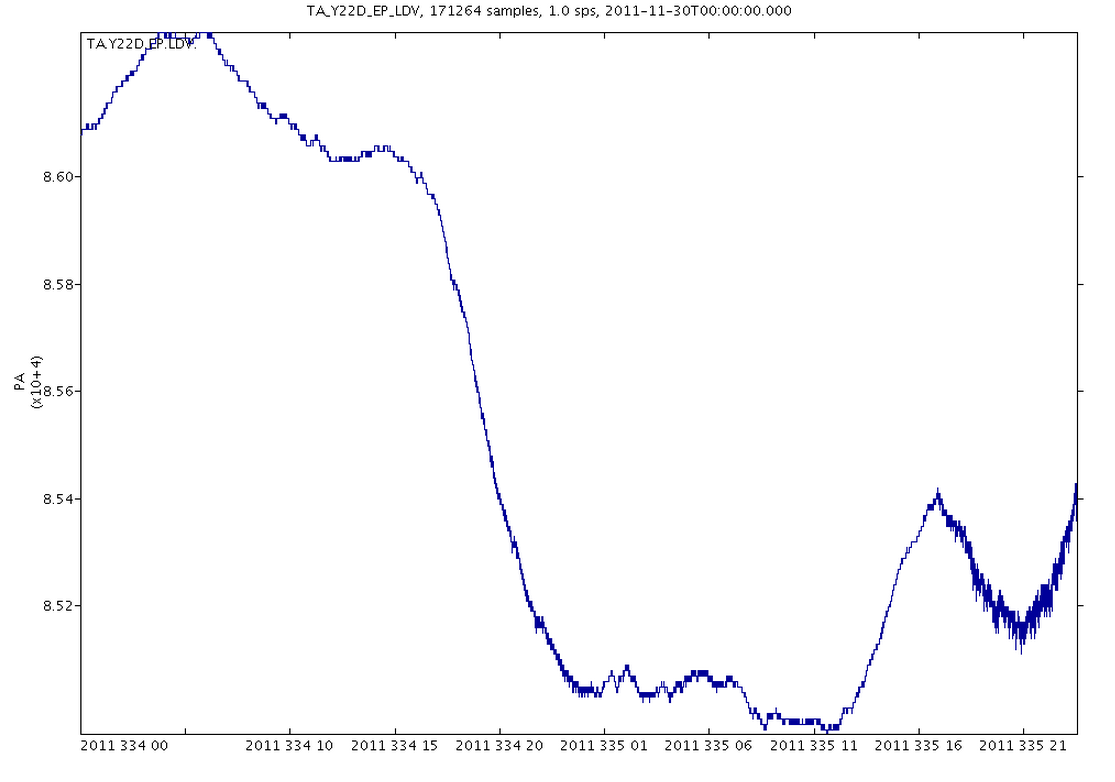
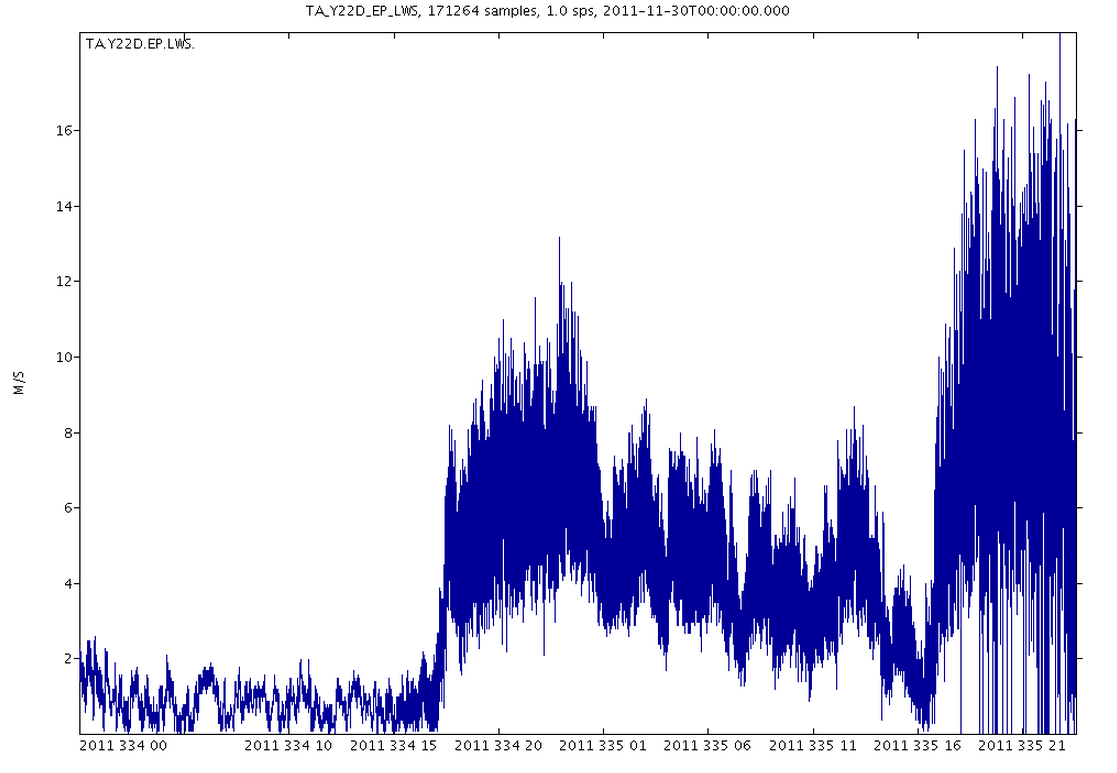
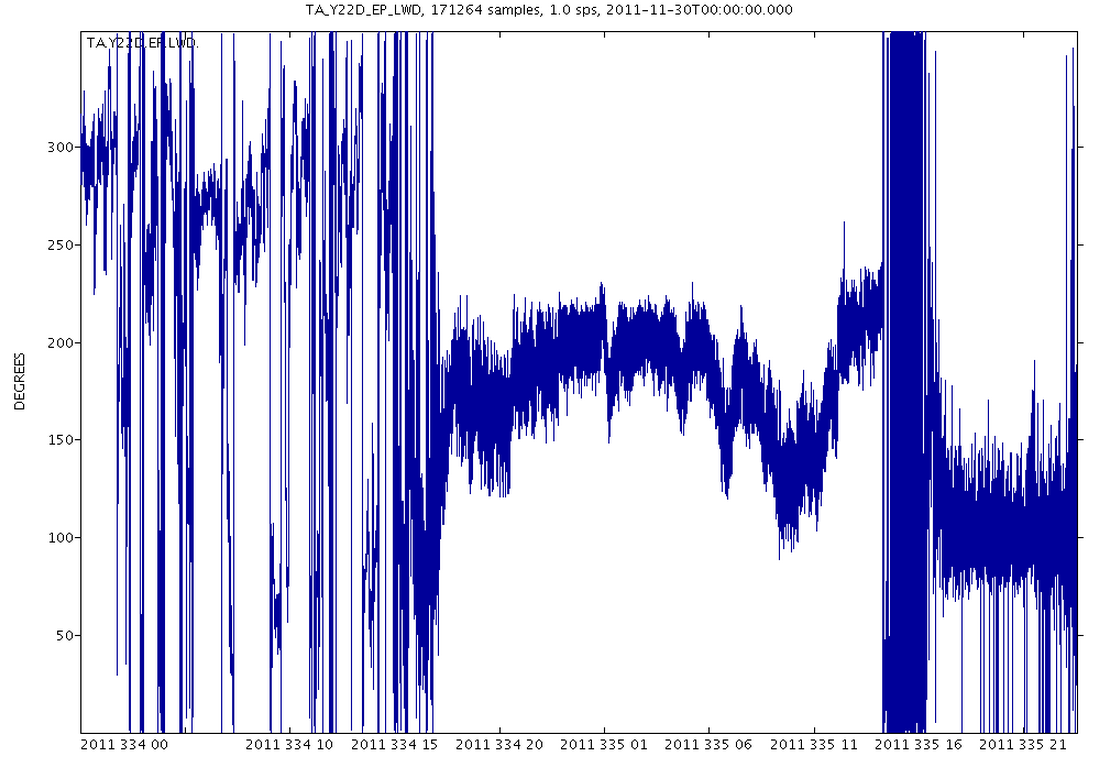
For future deployments of the Transportable array, individual stations will include the Vaisala WXT-520 “all-in-one” weather sensor. This sensor measures six weather parameters. (temperature, pressure, humidity, wind speed, wind direction, and precipitation). Currently station Y22D in Socorro, New Mexico is equipped with the Vaisala sensor. The following figures were created using the web services timeseries URL builder and show temperature, pressure, humidity, wind speed, and wind direction over a three-day period when a powerful winter storm was present in New Mexico.

The SPUD program is another way to obtain infrasound visualizations. SPUD creates visualizations of events that are large enough to be detected by multiple Transportable Array (TA) stations. The close proximity of the TA to rocket launches in Florida has enabled the visualization of infrasonic fluctuations created by these launches. See example below.
Infrasonic waves can be created from many types of events. Please visit the SPUD Infrasound webpage to investigate further.
A list of known infrasound events can be found here.

Delta IV launch infrasound traveling across TA stations within a 10 degree radius.
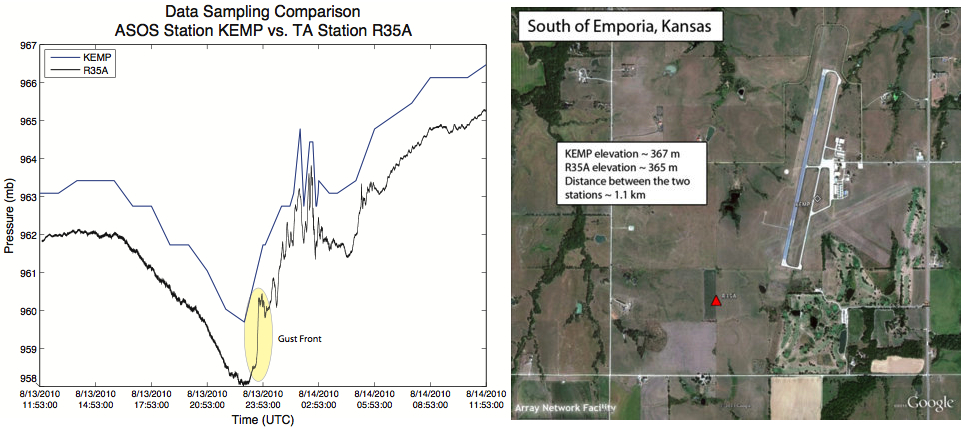
An example of two near by sensors with different sampling rates.
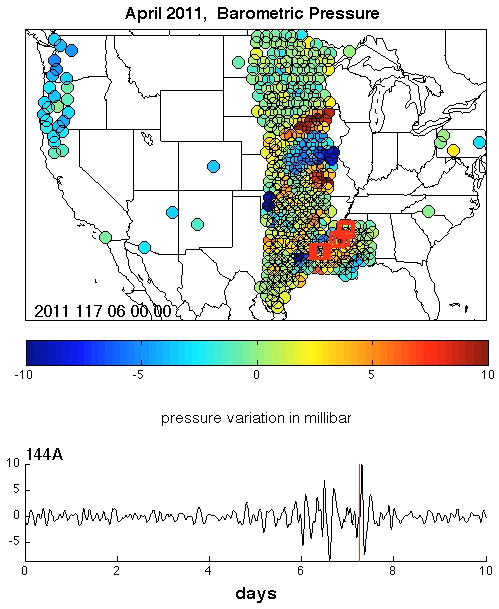
The high spatial resolution of barometric measurements can be adapted to demonstrate large scale atmospheric processes due to the dense spacing of the Transportable Array. This animation demonstrates filtered pressure readings spanning 10 days in April 2011, including several major severe weather outbreaks. Data are filtered between periods of 2 hours to 6 hours. A filtered timeseries of barometric pressure at station 144A, located in west-central Mississippi, shows a generalized pressure signal. Tornado touchdowns are shown by the red squares that appear and disappear. "Year day hour min sec" time count is in lower left of map. Click the image below to view the movie.
 :
:

